
Live Weather Radar: Complete Technical Guide to Tracking Local Storms and Reading Radar Maps

Introduction
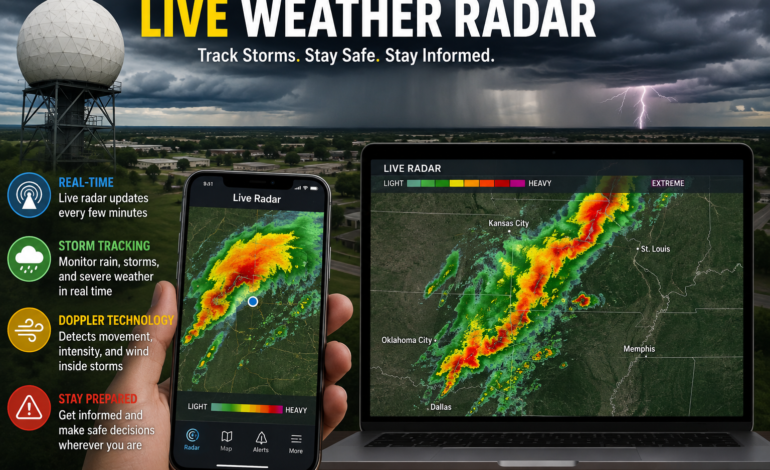
Navigating rapidly changing atmospheric conditions requires reliable, real-time data. While traditional daily weather reports provide a broad overview of high and low temperatures, a live weather radar gives immediate visual clarity regarding the exact movement, intensity, and duration of incoming precipitation. Modern digital mapping tools have made high-resolution meteorological data accessible to anyone with a smartphone or computer. Understanding how to interpret an interactive weather radar map allows individuals, commuters, outdoor professionals, and emergency responders to make safe, well-informed decisions based on actionable real-time information.
The Physics and Engineering Behind Doppler Weather Radar
Public weather monitoring systems rely on networks of ground-based stations equipped with advanced Doppler radar systems, such as the NEXRAD (Next-Generation Radar) network managed by the National Weather Service in the United States, along with similar meteorological agencies worldwide. To read radar displays effectively, it helps to understand the underlying physical principles governing radar operations.
                  [ NEXRAD Ground Station ]
                             │
       ┌─────────────────────┴─────────────────────┐
       │ Pulse Emitted (360° Rotating Radar Dish)   │
       └─────────────────────┬─────────────────────┘
                             │
                             ▼
              [ Atmospheric Target / Cloud ]
             (Rain Drops, Hail, Snowflakes)
                             │
       ┌─────────────────────┴─────────────────────┐
       │ Signal Bounces Back to Receiver Dish     │
       └─────────────────────┬─────────────────────┘
                             │
                             ▼
      [ Processor Calculates Distance, Volume & Motion ]
Signal Emission and Wave Reflection
A Doppler radar installation consists of a parabolic antenna housed inside a protective spherical radome. The antenna continuously rotates 360 degrees while sweeping at various vertical tilt angles. It emits high-powered pulses of microwave radiation into the atmosphere at or near the speed of light.
When these electromagnetic pulses encounter targets in the sky—such as raindrops, hail, sleet, or snowflakes—a fraction of the wave’s energy bounces off the precipitation and reflects back to the radar dish. The radar system measures the precise duration between sending the pulse and receiving the reflected wave to calculate the exact distance to the precipitation target.
Measuring Reflectivity and Density
The volume of energy returned to the dish indicates the density and size distribution of the moisture droplets inside the cloud. Larger raindrops, high concentrations of water, or solid ice structures like hail reflect significantly more energy back to the antenna than small drizzle droplets or sparse snowflakes. Meteorologists quantify this returning energy as reflectivity, which forms the basis of the standard color scales displayed on everyday consumer weather applications.
The Doppler Effect and Wind Velocity Measurement
Beyond measuring moisture concentration, modern systems utilize the Doppler Effect to determine movement within storm clouds. As a storm moves toward or away from the radar dish, the frequency of the returning radio waves shifts slightly.
By calculating this subtle frequency shift, the radar processor determines both the speed and the horizontal wind direction inside cloud formations. This specific capability allows meteorologists to spot rapid wind shear, identify dangerous microbursts, and detect rotation within convective thunderstorms minutes before tornadoes develop on the ground.
Decoding Radar Displays: Understanding dBZ and Color Reflectivity
When viewing a storm tracking map, the varied colors painted across the geographic layout represent doppler reflectivity. This metric is measured on a logarithmic scale called decibels of Z (dBZ). Understanding how numeric dBZ values correlate to ground-level weather helps users assess potential outdoor hazards accurately.
       LIGHT                      MODERATE                      SEVERE
  (15 - 30 dBZ)                 (30 - 45 dBZ)               (45 - 60+ dBZ)
      Green                        Yellow/Orange                Red/Purple
  ┌───────────┐                 ┌────────────────┐           ┌──────────────┐
  │ Drizzle   │                 │ Steady Rain    │           │ Downpours    │
  │ Light Rain│                 │ Reduced Driver │           │ Lightning    │
  │ Mist      │                 │ Visibility     │           │ Hail/Squalls │
  └───────────┘                 └────────────────┘           └──────────────┘
| Reflectivity (dBZ) | Color Equivalent | Environmental Precipitation State | Practical Driving & Outdoor Impact |
|---|---|---|---|
| 5 – 15 dBZ | Cyan / Light Blue | Ice crystals, light freezing drizzle, virga | Minimal surface impact; potential trace moisture |
| 15 – 30 dBZ | Light to Dark Green | Light drizzle to moderate continuous rain | Roads become wet; light rain gear recommended |
| 30 – 40 dBZ | Yellow | Steady, moderate rainfall; small water pooling | Reduced roadway traction; wipers needed |
| 40 – 50 dBZ | Orange to Light Red | Heavy rainfall, gusty winds, thunder | Hydroplaning risk; reduced driver visibility |
| 50 – 60 dBZ | Dark Red to Magenta | Severe downpours, frequent lightning, small hail | Dangerous travel conditions; pull over safely |
| 60+ dBZ | White / Bright Purple | Extreme convective cells, severe hail, damaging winds | High risk of structural damage and flooding |
Light Moisture Layers (5 to 30 dBZ)
Reflectivity values below 30 dBZ appear as shades of green or light cyan. These signatures represent light rain showers, misty conditions, or elevated clouds carrying minimal moisture. Outdoor activities can generally proceed in green zones with standard waterproof clothing, as ground accumulation remains low and severe winds are unlikely.
Moderate Precipitation Layers (30 to 45 dBZ)
Yellow and orange regions signal a clear step up in rain volume and atmospheric turbulence. Water begins to pool on roadways rapidly, creating slick surfaces and increasing the risk of vehicle hydroplaning. When yellow or orange bands cover your immediate area, expect steady downpours that require reduced driving speeds and careful attention on the road.
Severe Atmospheric Cells (45 to 60+ dBZ)
Red, magenta, and white sections mark powerful convective storm cores. Values exceeding 50 dBZ indicate intense tropical downpours or violent convective thunderstorms containing significant electrical activity. Bright white or pink pixels inside a storm core frequently highlight large hail suspended by strong updrafts. When tracking a severe cell heading along your route, seek shelter immediately and avoid driving through low-lying areas prone to flash flooding.
Core Capabilities of an Interactive Weather Radar Map
Static radar photos provide only a quick snapshot of conditions that existed minutes in the past. To maintain accurate situational awareness, users must interact with live digital displays and utilize key functional layers.
+-----------------------------------------------------------------------------------+
|                        ADVANCED RADAR INTERFACE LAYERS                            |
+--------------------------+--------------------------------------------------------+
| 🔁 Animated Loop         | Displays 30-60 minute trajectory and speed trends.     |
| ⚡ Lightning Tracker     | Pinpoints ground strikes in active convective cores.  |
| 🎈 Barometric Troughs    | Identifies sharp pressure drops driving squall lines.  |
| 🌡️ Temperature Boundary  | Maps the freezing line during rain-to-snow transitions. |
| 💨 Surface Wind Vector    | Displays localized gust speed and directional shifts.  |
+--------------------------+--------------------------------------------------------+
Utilizing Animated Radar Loops
Activating a radar loop function plays a sequential timeline of frame captures over the previous 30 to 60 minutes. Observing this historical animation allows you to determine three critical variables:
- Vector Direction: The precise path the main storm cell is traveling relative to your neighborhood.
- Speed of Advance: The rate at which the rain wall is moving across geographic boundaries.
- Cell Lifecycle: Whether the high-intensity red cores are expanding (strengthening) or shrinking (dissipating) as time progresses.
Integrating Multi-Layered Overlays
Modern weather mapping platforms allow users to stack complementary meteorological data directly over the primary precipitation layer:
- Real-Time Lightning Maps: Detects cloud-to-ground electrical discharges, allowing users to calculate how close an active thunderstorm cell is to their location.
- Barometric Pressure Profiles: Highlights deep low-pressure centers that trigger high surface winds and rapid weather shifts.
- Surface Wind Vectors: Overlays arrow pathways showing localized wind direction and gust speeds accompanying approaching cold fronts.
- Satellite Infrared Layers: Fills in broad coverage gaps by displaying high-altitude cloud structures across areas where ground radar coverage is sparse.
Rain Radar vs. Snow Radar: Technical and Structural Differences
Monitoring winter precipitation involves unique challenges that do not apply to tracking summer rain showers. Liquids and solids interact differently with microwave signals, altering how a snow radar processes returned data.
      CONVECTIVE SUMMER RAIN                    STRATIFORM WINTER SNOW

    ┌─────────────────────────┐               ┌─────────────────────────┐
    │ Highly Reflective Drops │               │ Irregular Ice Crystals  │
    │ High dBZ (35 to 50+)    │               │ Low dBZ (10 to 30)      │
    │ Tall Convective Clouds  │               │ Low-Altitude Stratum    │
    │ High Return Signal      │               │ Beam Overshoot Risk     │
    └─────────────────────────┘               └─────────────────────────┘
Density and Signal Reflection Properties
Spherical, liquid water droplets possess high dielectric constants, making them excellent reflectors of microwave energy. Consequently, summer rainstorms produce sharp, high-contrast returns that display clearly as vivid greens, yellows, and reds.
Conversely, snowflakes are complex, low-density ice crystals containing significant trapped air. Because ice reflects less microwave energy than liquid water, heavy snowfall may only register between 20 dBZ and 30 dBZ on standard radar equipment. As a result, a winter system showing light green or muted teal can still cause heavy snowfall on the ground.
The Problem of Beam Overshoot
Summer convective clouds often extend tens of thousands of feet up into the troposphere, making them easy targets for ground radar sweeps. Winter snow clouds, however, typically sit much lower to the ground.
Because radar beams travel in straight lines while the Earth curves beneath them, a radar signal gains altitude relative to the ground as it travels farther from the station. At distances greater than 50 to 80 miles from an antenna, the radar beam may pass directly over the top of low-altitude snow clouds, completely missing active winter weather occurring at ground level.
Common Technical Anomalies and Limitations in Radar Coverage
Interpreting a rain tracker accurately requires knowing when a map display is showing false readings or experiencing interference. Radar hardware faces several natural and technical constraints.
                            [ Ground Station ]
                                    │
               ┌────────────────────┴────────────────────┐
               │ Radar Beam Sweeps Elevated Atmosphere   │
               └────────────────────┬────────────────────┘
                                    │
                                    ▼
                      [ High-Altitude Moisture Layer ]
                                    │
                                    ▼  (Rain Drops Fall Into Warm Dry Air)

                             💧 Virga Layer 💧
                         (Evaporates Before Surface)
                                    │
                                    ❌
                             [ Dry Ground Level ]
Virga: Evaporating Rain Overhead
One of the most frequent point-of-use discrepancies occurs when radar indicates precipitation directly overhead, yet no moisture reaches the pavement. This scenario is typically caused by virga—rain or snow falling from cloud bases high up in the atmosphere that evaporates upon hitting dry air layers closer to the ground. Because the radar beam scans thousands of feet above ground level, it registers moisture high in the sky that never makes impact at the surface.
Beam Attenuation During Severe Storms
When a radar pulse hits an extremely dense wall of heavy rain or hail close to the transmitter site, the moisture can absorb or scatter almost the entire signal. As a result, very little wave energy penetrates through to the back side of the storm core. This effect, known as beam attenuation, can blind the radar to additional severe weather cells lying directly behind the lead storm cell.
Anomalous Propagation and Ground Clutter
During clear nights with temperature inversions—where a layer of warm air sits above cold air near the ground—the radar beam can bend downward toward the Earth rather than traveling slightly upward through the atmosphere. The bent signal strikes ground features such as hills, tall buildings, or ocean waves, bouncing back to the receiver. The system misinterprets these ground returns as heavy, stationary precipitation, creating artificial green or yellow patches on clear weather days.
Step-by-Step Practical Routine for Storm Tracking
To stay safe during incoming weather events, apply this structured review process when checking your local weather radar near me:
[1. Set Location] ──> [2. Run Loop] ──> [3. Check dBZ Core] ──> [4. Review Alerts] ──> [5. Verify Layer]
Step 1: Confirm Geographic Positioning
Open your interactive map and enable location services, or type in your target zip code. Confirm that your interface is sourcing data from the nearest operating radar station to minimize beam overshoot and elevation errors.
Step 2: Analyze the 30-Minute Radar Loop
Start the animated loop feature to evaluate storm movement over the past half-hour. Draw a mental line projecting the cell’s current trajectory forward across the map to determine if your location lies in its direct path.
Step 3: Evaluate Reflectivity and Color Gradients
Examine the colors in the leading edge and core of the storm system. If the leading edge transitions rapidly from green to deep red over a short geographic distance, prepare for strong wind gusts and intense downpours as the atmospheric front arrives.
Step 4: Monitor Official Warnings and Emergency Polygons
Watch for brightly colored warning polygons overlaid across the radar interface. The National Weather Service draws these official boundary boxes to mark specific threats:
- Yellow Polygons: Severe Thunderstorm Watches or Warnings.
- Red Polygons: Active Tornado Warnings requiring immediate shelter.
- Green Polygons: Flash Flood Warnings for low-lying areas.
Step 5: Verify Atmospheric Layers with Hourly Updates
Cross-reference your visual radar readings with ambient surface temperature readings, hourly weather updates, and localized wind reports. Checking these parameters confirms whether incoming moisture will stay liquid or transition into sleet or freezing rain as surface temperatures drop.
Frequently Asked Questions About Weather Radar Systems
How frequently do interactive radar maps update?
Standard ground-based NEXRAD installations complete full volume coverage scans every 4 to 6 minutes, depending on their operating mode. During severe weather events, stations switch to high-speed scanning modes that refresh low-level reflectivity data roughly every 1 to 2 minutes.
Why does a radar loop sometimes show sudden gaps or missing frames?
Missing frames occur when a radar station transitions between operational modes, undergoes routine calibration, or loses data transmission links during high-intensity storms. Most digital map providers display a timestamp on screen so users can verify data freshness.
Can radar systems detect non-weather objects in the sky?
Yes, modern high-sensitivity Doppler radars frequently detect non-hydrometeor targets. Large swarms of migratory birds, dense bat colonies exiting caves, wildfire smoke plumes, and even swarms of insects show up on sensitive reflectivity sweeps, often displaying as faint, expanding circular patterns on clear days.
Using Weather Radar for Safer Outdoor Decisions
Relying solely on simple text forecasts leaves you vulnerable to sudden shifts in timing and storm intensity. Mastering an interactive weather radar map provides clear visibility into changing atmospheric conditions, replacing guesswork with accurate real-time data.
By understanding doppler reflectivity scales, tracking animated movement trends, and accounting for technical limitations like virga, you can read complex meteorological data with confidence. Using these interactive radar tools empowers you to protect your family, secure property, and make smart, timely travel decisions whenever severe weather threatens your region.